


Question
Question asked by Filo student
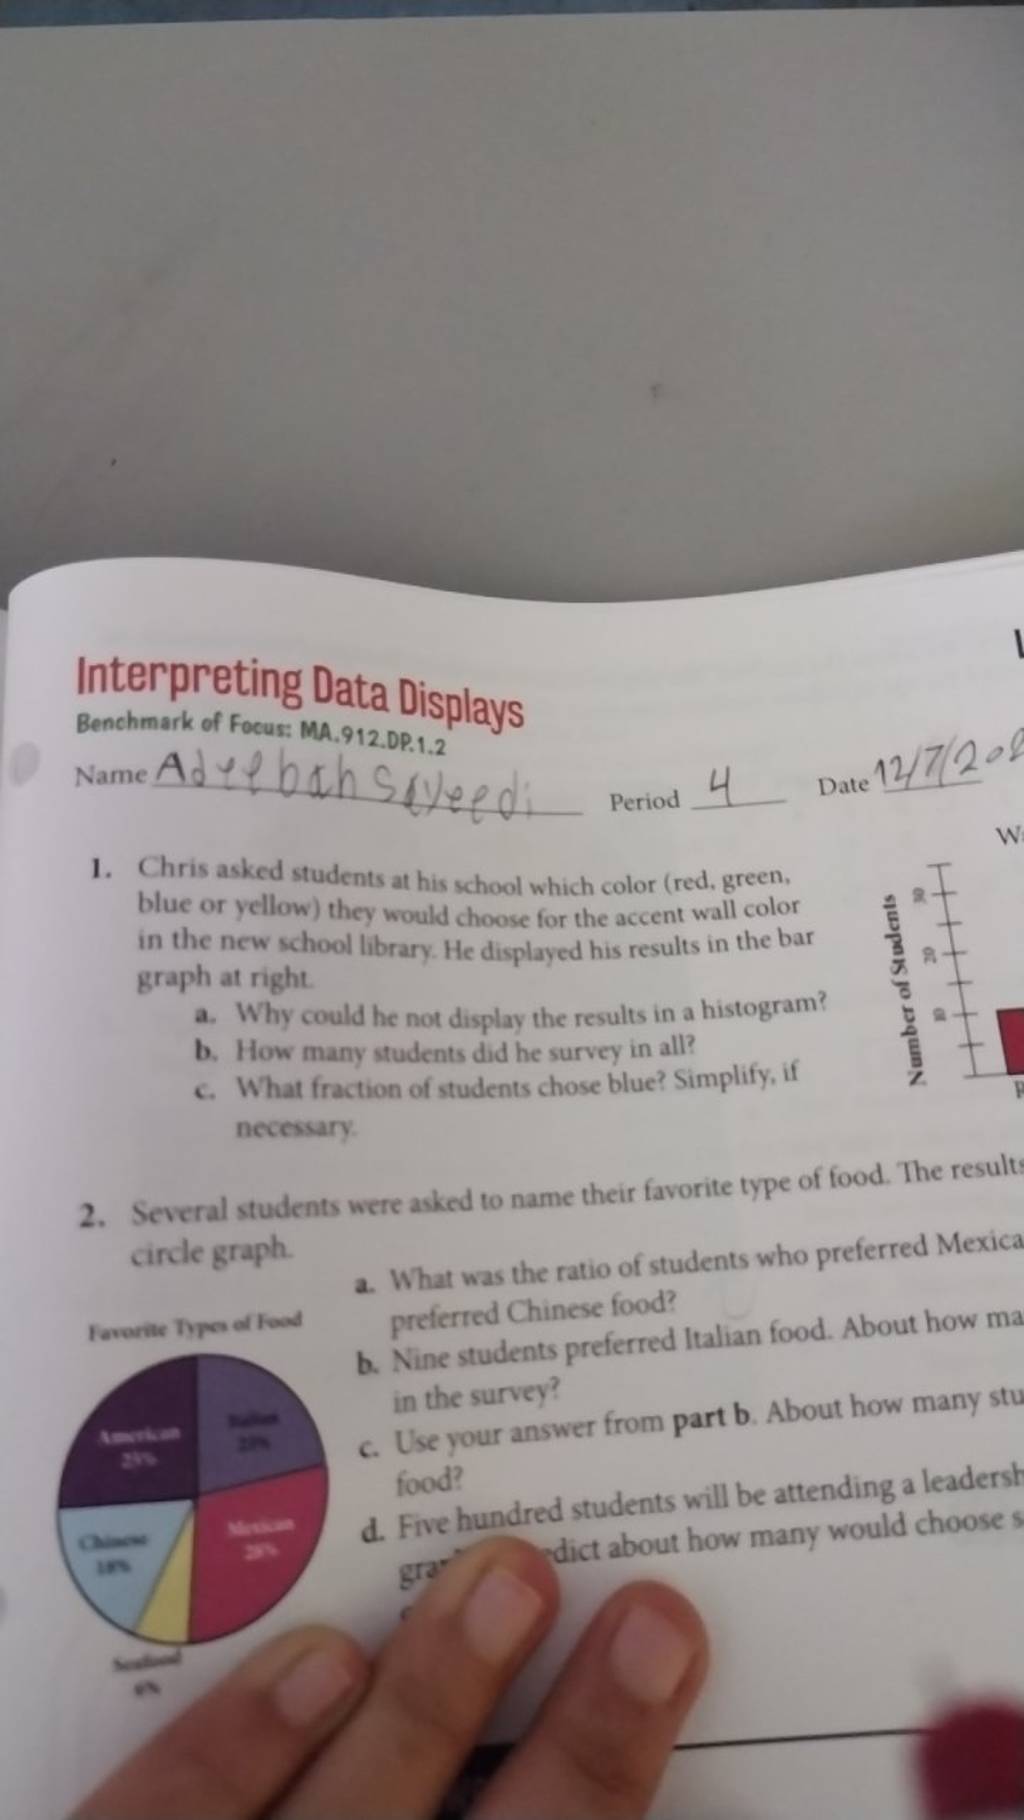
Interpreting Data Displays Benchmark of Focus: MA.912.DP.1.2 Name Adel oth Syleedi Period 4 Date 1. Chris asked students at his school which color (red, green, blue or yellow) they would choose for the accent wall color in the new school library. He displayed his results in the bar graph at right.
- Why could he not display the results in a histogram?
- How many students did he survey in all?
- What fraction of students chose blue? Simplify, if necessary.
Views: 5,929 students
Found 2 tutors discussing this question
Discuss this question LIVE
14 mins ago
Filo tutor solution
Learn from their 1-to-1 discussion with Filo tutors.

Generate FREE solution for this question from our expert tutors in next 60 seconds
Don't let anything interrupt your homework or exam prep with world’s only instant-tutoring, available 24x7
Students who ask this question also asked
View more| Question Text | Interpreting Data Displays Benchmark of Focus: MA.912.DP.1.2 Name Adel oth Syleedi Period 4 Date 1. Chris asked students at his school which color (red, green, blue or yellow) they would choose for the accent wall color in the new school library. He displayed his results in the bar graph at right. |
| Topic | The Chemistry of Abiotic Systems & Energy of Chemical Systems |
| Subject | Chemistry |
| Class | High School |
