


Physics
Class 9
Lakhmir Singh
1
Chapter 1: Motion
117 questions
Q1
Question 54:
What can you say about the motion of a body if :
(a) its displacement-time graph is a straight line?
(b) its velocity-time graph is a straight line?
(a) its displacement-time graph is a straight line?
(b) its velocity-time graph is a straight line?
Q2
Question 60:
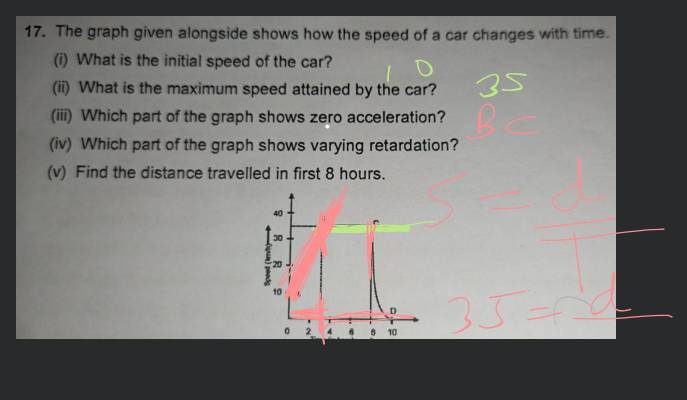
The graph given alongside shows how the speed of a car changes with time :
Figure
(i) What is the initial speed of the car?
(ii) What is the maximum speed attained by the car?
(iii) Which part of the graph shows zero acceleration
(iv) Which part of the graph shows varying retardation?
(v) Find the distance travelled in first 8 hours.
Figure
(i) What is the initial speed of the car?
(ii) What is the maximum speed attained by the car?
(iii) Which part of the graph shows zero acceleration
(iv) Which part of the graph shows varying retardation?
(v) Find the distance travelled in first 8 hours.
Q3
Question 61:
Three speed-time graphs are given below :
Figure
Which graph represents the case of :
(i) a cricket ball thrown vertically upwards and returning to the hands of the thrower?
(ii) a trolley decelerating to a constant speed and then accelerating uniformly?
View all questionFigure
Which graph represents the case of :
(i) a cricket ball thrown vertically upwards and returning to the hands of the thrower?
(ii) a trolley decelerating to a constant speed and then accelerating uniformly?
2
Chapter 2: Force and Laws of Motion
114 questions
3
Chapter 3: Gravitation
157 questions
4
Chapter 4: Work and Energy
128 questions
5
Chapter 5: Sound
162 questions
Question
Question 60:
The graph given alongside shows how the speed of a car changes with time :
Figure
(i) What is the initial speed of the car?
(ii) What is the maximum speed attained by the car?
(iii) Which part of the graph shows zero acceleration
(iv) Which part of the graph shows varying retardation?
(v) Find the distance travelled in first 8 hours.
Views: 5,314 students
Found 8 tutors discussing this question
Discuss this question LIVE
14 mins ago
 Text solution
 Verified
Answer:
(i) Initial speed of the car is 10 km/h
(ii) Maximum speed attained by the car is 35km/h
(iii) BC represents zero acceleration.
(iv) CD represents varying retardation.
(v) Distance travelled is given by the area enclosed within the curve. So,
Distance travelled = Area or trapezium + Area of rectangle
So distance travelled,
= (1/2)(8+5)(25) + (8)(10)
= 242.5 km
Was this solution helpful?
44
Share
Report
Filo tutor solutions (1)
Learn from their 1-to-1 discussion with Filo tutors.
4 mins
Uploaded on: 2/22/2023
Connect instantly with this tutor
Connect now
Taught by

Deepak
Total classes on Filo by this tutor - 7,281
Teaches : Science, Mathematics
Connect instantly with this tutor
Notes from this class (3 pages)
Was this solution helpful?
119
Share
Report

One destination to cover all your homework and assignment needs
Learn Practice Revision Succeed

Instant 1:1 help, 24x7
60, 000+ Expert tutors

Textbook solutions
Big idea maths, McGraw-Hill Education etc

Essay review
Get expert feedback on your essay

Schedule classes
High dosage tutoring from Dedicated 3 experts
Practice more questions from Physics (Lakhmir Singh)
Q1
Question 54:
What can you say about the motion of a body if :
(a) its displacement-time graph is a straight line?
(b) its velocity-time graph is a straight line?
(a) its displacement-time graph is a straight line?
(b) its velocity-time graph is a straight line?
Q2
Question 60:
The graph given alongside shows how the speed of a car changes with time :
Figure
(i) What is the initial speed of the car?
(ii) What is the maximum speed attained by the car?
(iii) Which part of the graph shows zero acceleration
(iv) Which part of the graph shows varying retardation?
(v) Find the distance travelled in first 8 hours.
Figure
(i) What is the initial speed of the car?
(ii) What is the maximum speed attained by the car?
(iii) Which part of the graph shows zero acceleration
(iv) Which part of the graph shows varying retardation?
(v) Find the distance travelled in first 8 hours.
Q3
Question 61:
Three speed-time graphs are given below :
Figure
Which graph represents the case of :
(i) a cricket ball thrown vertically upwards and returning to the hands of the thrower?
(ii) a trolley decelerating to a constant speed and then accelerating uniformly?
View allFigure
Which graph represents the case of :
(i) a cricket ball thrown vertically upwards and returning to the hands of the thrower?
(ii) a trolley decelerating to a constant speed and then accelerating uniformly?
Practice questions from Physics (Lakhmir Singh)
Question 1
Views: 5,803
(a) 0
(b) πr
(c) 2r
(d) 2πr
Question 2
Views: 5,556
Question 3
Views: 5,155
Figure
(a) car A is faster than car D
(b) car B is the slowest
(c) car D is faster than the car C
(d) car C is the slowest
Practice more questions from Motion
Question 2
Medium
Views: 5,524
Practice questions on similar concepts asked by Filo students
Question 1
Views: 5,639
Question 2
Views: 5,378
Question 4
Views: 5,355


Stuck on the question or explanation?
Connect with our Science tutors online and get step by step solution of this question.
231 students are taking LIVE classes


| Question Text | Question 60:
The graph given alongside shows how the speed of a car changes with time : Figure (i) What is the initial speed of the car? (ii) What is the maximum speed attained by the car? (iii) Which part of the graph shows zero acceleration (iv) Which part of the graph shows varying retardation? (v) Find the distance travelled in first 8 hours. |
| Updated On | Feb 22, 2023 |
| Topic | Motion |
| Subject | Science |
| Class | Class 9 |
| Answer Type | Text solution:1 Video solution: 1 |
| Upvotes | 163 |
| Avg. Video Duration | 4 min |
