


Question
Draw V-T curve
Views: 565 students
Found 8 tutors discussing this question
Discuss this question LIVE
14 mins ago
 Text solution
 Verified
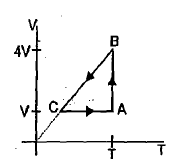
V-T curve for all process is shown in figure. The initial state is represented by the point. In the first step, it is isothermally expanded to a volume 4V. This is shown by AB. Then the pressure is kept constant and the gas is compressed to the initial volume V. From the identity gas equation, V/T is constant at constant pressure (PV =nRT). Hence, the process shown by a line BC which passes through the origin. At point C, the volume is V. In the first step, the gas is heated at constant volume to a temperature T. This is shown by CA. The final state is the same as the initial state.
Was this solution helpful?
150
Share
Report

One destination to cover all your homework and assignment needs
Learn Practice Revision Succeed

Instant 1:1 help, 24x7
60, 000+ Expert tutors

Textbook solutions
Big idea maths, McGraw-Hill Education etc

Essay review
Get expert feedback on your essay

Schedule classes
High dosage tutoring from Dedicated 3 experts
Practice questions from similar books
Question 1
A thermodynamical process is shown in the figure. The pressure and volumes corresponding to some points in the figure are In the process , of heat is added to the system and in process of heat is added to the system. The change in internal energy of the system in process would beQuestion 2
Which one of the following substance has highest specific heat capacity at room temperature and atmospheric pressure?

Stuck on the question or explanation?
Connect with our physics tutors online and get step by step solution of this question.
231 students are taking LIVE classes
| Question Text | Draw V-T curve |
| Answer Type | Text solution:1 |
| Upvotes | 150 |
