


Question
A radicactive sample consider of two distinct species having equial number initially . The mean life time of one species is and that of the other is . The decay prodects in both cases are stable . A plot is made of the total number of radioactive nuclei as a function of time , which of the following figure best represent the from of this plot?
A
B
C
D
Views: 892 students
Found 7 tutors discussing this question
Discuss this question LIVE
9 mins ago
 Text solution
 Verified
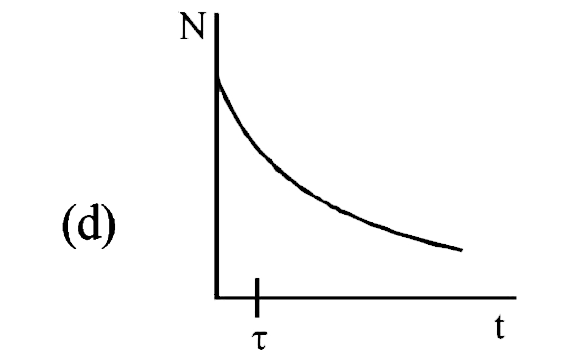
Answer: DSolution: `N_(1) = N_(oe)^(-lambda _(1) t = N_(0e) ^(t/tau)` ….(i)
`as tau = (1)/(lambda_(1))`
`N_(2) = N_(0e) ^(-lambda_(2)t) = N_(0e) ^(t/5tau) ` ….(i) as `5 tau = (1)/(lambda_(2))`
Adding (i) and (ii) we get
`N = N_(1)+ N_(2) = N_(0)(e^(-t//tau) + e^(-t//5 tau) )
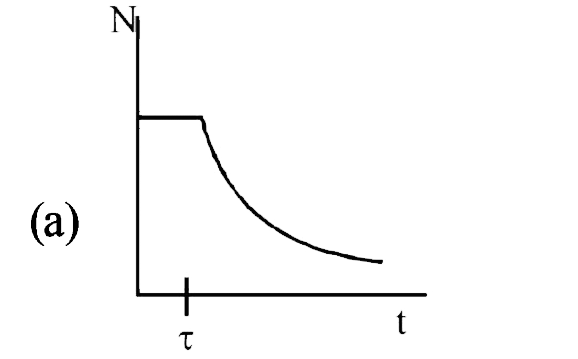
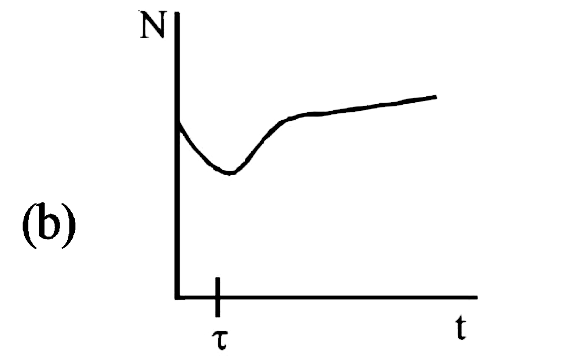
(a) in NOT the carrect option as there is a time `tau` for which `N` is constant which means for time `tau` there is no process of radioactivity which does not make same . (b) and (c ) shown intermediate increase in the numberof radicacitive atom which is IMMPOSSIBLE as `N` willl only decrease exponentially.
`as tau = (1)/(lambda_(1))`
`N_(2) = N_(0e) ^(-lambda_(2)t) = N_(0e) ^(t/5tau) ` ….(i) as `5 tau = (1)/(lambda_(2))`
Adding (i) and (ii) we get
`N = N_(1)+ N_(2) = N_(0)(e^(-t//tau) + e^(-t//5 tau) )
(a) in NOT the carrect option as there is a time `tau` for which `N` is constant which means for time `tau` there is no process of radioactivity which does not make same . (b) and (c ) shown intermediate increase in the numberof radicacitive atom which is IMMPOSSIBLE as `N` willl only decrease exponentially.
Was this solution helpful?
150
Share
Report

One destination to cover all your homework and assignment needs
Learn Practice Revision Succeed

Instant 1:1 help, 24x7
60, 000+ Expert tutors

Textbook solutions
Big idea maths, McGraw-Hill Education etc

Essay review
Get expert feedback on your essay

Schedule classes
High dosage tutoring from Dedicated 3 experts
Practice questions from similar books
Question 1
A radio nuclide X is produced at constant rate . At time , number of nuclei of X are zero. Find (a) the maximum number of nuclei of X.
the number of nuclei at time t.
Decay constant of X is .
Question 2
In the option given below , let denote the rest mass energy of a nucleas and a neutron .The correct option isQuestion 3
The elecron curium On has a mean life of second ist pirmary dacay mode with a probilly of and the letter with a probillty of Each fission released of energy . The masses involved in a - dacay are as follows 

Stuck on the question or explanation?
Connect with our physics tutors online and get step by step solution of this question.
231 students are taking LIVE classes
| Question Text | A radicactive sample consider of two distinct species having equial number initially . The mean life time of one species is and that of the other is . The decay prodects in both cases are stable . A plot is made of the total number of radioactive nuclei as a function of time , which of the following figure best represent the from of this plot? |
| Answer Type | Text solution:1 |
| Upvotes | 150 |
