


Question
Medium
Solving time: 3 mins
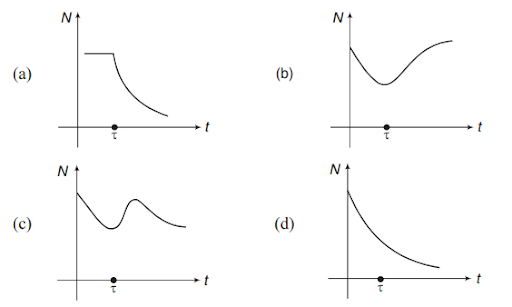
A radioactive sample consists of two distinct species having equal number of atoms initially. The mean life of one species is and that of the other is . The decay products in both cases are stable. A plot is made of the total number of radioactive nuclei as a function of time. Which of the following figure best represents the form of this plot?
Views: 5,359 students
Found 2 tutors discussing this question
Michael Discussed
A radioactive sample consists of two distinct species having equal number of atoms initially. The mean life of one species is and that of the other is . The decay products in both cases are stable. A plot is made of the total number of radioactive nuclei as a function of time. Which of the following figure best represents the form of this plot?
9 mins ago
Discuss this question LIVE
9 mins ago
 Text solution
 Verified
The total number of atoms can neither remain constant (as in option a) nor can ever increase (as in options b and c). They will continuously decrease with time. Therefore, (d) is the appropriate option.
Was this solution helpful?
81
Share
Report

One destination to cover all your homework and assignment needs
Learn Practice Revision Succeed

Instant 1:1 help, 24x7
60, 000+ Expert tutors

Textbook solutions
Big idea maths, McGraw-Hill Education etc

Essay review
Get expert feedback on your essay

Schedule classes
High dosage tutoring from Dedicated 3 experts
Practice questions from Optics And Modern Physics (DC Pandey)
Question 1
Medium
Views: 5,710
(a) number of nuclei of as function of time .
(b) time at which the activity of is maximum and the value of maximum activity of .
Question 2
Easy
Views: 5,778
Question 3
Medium
Views: 5,659
Question 4
Medium
Views: 5,963
Practice more questions from Nuclei
Question 1
Easy
Views: 6,123
Question 2
Easy
Views: 5,793
Question 3
Medium
Views: 5,289
mixture has of and of . The amount of the two in the mixture will become equal after
Practice questions on similar concepts asked by Filo students
Question 1
Views: 5,906
Question 2
Views: 5,107
Question 3
Views: 5,248
Question 4
Views: 5,446


Stuck on the question or explanation?
Connect with our Physics tutors online and get step by step solution of this question.
231 students are taking LIVE classes


| Question Text | A radioactive sample consists of two distinct species having equal number of atoms initially. The mean life of one species is and that of the other is . The decay products in both cases are stable. A plot is made of the total number of radioactive nuclei as a function of time. Which of the following figure best represents the form of this plot? |
| Topic | Nuclei |
| Subject | Physics |
| Class | Class 12 |
| Answer Type | Text solution:1 |
| Upvotes | 81 |
